State
Navigation: Configuration > IoT > Data > Metrics > State
The State tab displays the current values of all IoT metrics collected by the device. It provides a real-time overview of the most recently acquired measurement data, including the timestamp of the last reading, the metric path, and the current value. This read-only view is useful for verifying that data sources are delivering values as expected and for troubleshooting data acquisition issues. The metrics themselves are defined on the Metrics configuration tab, while the actual data acquisition from physical sources is configured under Configuration > IoT > Sources.
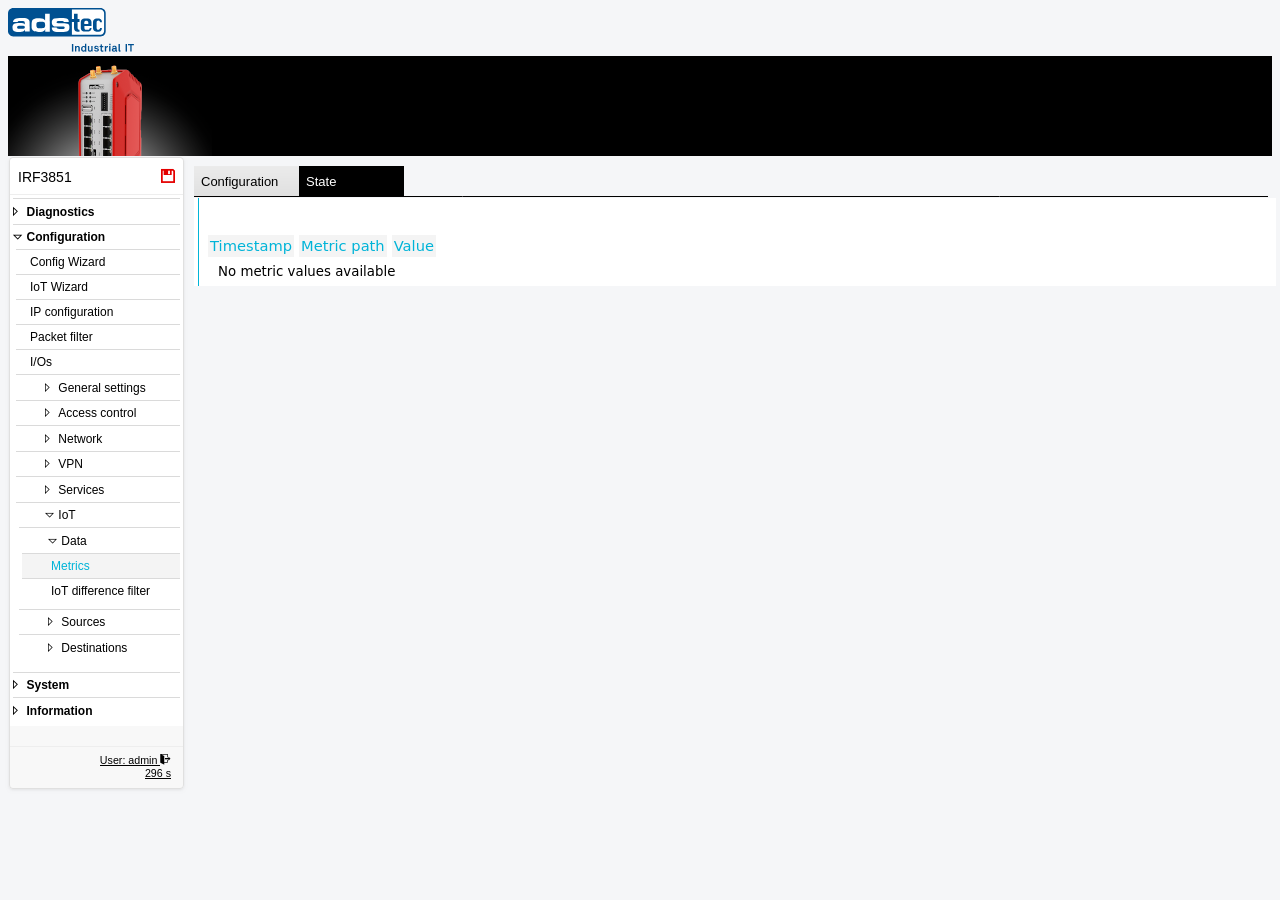
Displayed columns
- Timestamp
- The date and time when the metric value was last read from the data source. This indicates how recently the device polled the source. If a timestamp appears outdated, the corresponding source may be unreachable or the polling interval may be configured too long.
- Metric path
- The dataset path assigned to the metric on the Metrics configuration page. This path identifies the metric within the IoT data structure and corresponds to the path used when transmitting data to IoT destinations such as Big-LinX IoT push or MQTT destination.
- Value
- The most recently acquired value for this metric. The displayed value reflects the latest reading from the mapped data source (e.g., a Modbus register or an OPC UA node). Verify that the value falls within the expected range for the physical quantity being measured.
Note
If the message "No metric values available" is displayed, either no metrics have been defined on the Metrics page, no data sources have been configured and mapped under Configuration > IoT > Sources, or the data sources are not yet delivering values.